
Appendix D: Supplemental Information
| CD4 Percentage | Log10 HIV RNA Copy Number | ||||||
|---|---|---|---|---|---|---|---|
| Age | 10% | 20% | 25% | 30% | 6.0 | 5.0 | 4.0 |
| Percent Mortality (95% Confidence Interval) | |||||||
| 6 Months | 28.7 | 12.4 | 8.5 | 6.4 | 9.7 | 4.1 | 2.7 |
| 1 Year | 19.5 | 6.8 | 4.5 | 3.3 | 8.8 | 3.1 | 1.7 |
| 2 Years | 11.7 | 3.1 | 2.0 | 1.5 | 8.2 | 2.5 | 1.1 |
| 5 Years | 4.9 | 0.9 | 0.6 | 0.5 | 7.8 | 2.1 | 0.7 |
| 10 Years | 2.1 | 0.3 | 0.2 | 0.2 | 7.7 | 2.0 | 0.6 |
| Percent Developing AIDS (95% Confidence Interval) | |||||||
| 6 Months | 51.4 | 31.2 | 24.9 | 20.5 | 23.7 | 13.6 | 10.9 |
| 1 Year | 40.5 | 20.9 | 15.9 | 12.8 | 20.9 | 10.5 | 7.8 |
| 2 Years | 28.6 | 12.0 | 8.8 | 7.2 | 18.8 | 8.1 | 5.3 |
| 5 Years | 14.7 | 4.7 | 3.7 | 3.1 | 17.0 | 6.0 | 3.2 |
| 10 Years | 7.4 | 2.2 | 1.9 | 1.8 | 16.2 | 5.1 | 2.2 |
| Note: Table modified from: HIV Paediatric Prognostic Markers Collaborative Study Group. Lancet. 2003;362:1605-1611. | |||||||
| Age (Years) | Absolute CD4 Cell Count (cells/mm3) | |||||
|---|---|---|---|---|---|---|
| <50 | 50–99 | 100–199 | 200–349 | 350–499 | 500+ | |
| Rate of Death Per 100 Patient-Years | ||||||
| 0–4 | 59.3 | 39.6 | 25.4 | 11.1 | 10.0 | 3.5 |
| 5–14 | 28.9 | 11.8 | 4.3 | 0.89 | 0.00 | 0.00 |
| 15–24 | 34.7 | 6.1 | 1.1 | 0.71 | 0.58 | 0.65 |
| 25–34 | 47.7 | 10.8 | 3.7 | 1.1 | 0.38 | 0.22 |
| 35–44 | 58.8 | 15.6 | 4.5 | 0.92 | 0.74 | 0.85 |
| 45–54 | 66.0 | 18.8 | 7.7 | 1.8 | 1.3 | 0.86 |
| 55+ | 91.3 | 21.4 | 17.6 | 3.8 | 2.5 | 0.91 |
| Rate of AIDS or Death per 100 Patient-Years | ||||||
| 0–4 | 82.4 | 83.2 | 57.3 | 21.4 | 20.7 | 14.5 |
| 5–14 | 64.3 | 19.6 | 16.0 | 6.1 | 4.4 | 3.5 |
| 15–24 | 61.7 | 30.2 | 5.9 | 2.6 | 1.8 | 1.2 |
| 25–34 | 93.2 | 57.6 | 19.3 | 6.1 | 2.3 | 1.1 |
| 35–44 | 88.1 | 58.7 | 25.5 | 6.6 | 4.0 | 1.9 |
| 45–54 | 129.1 | 56.2 | 24.7 | 7.7 | 3.1 | 2.7 |
| 55+ | 157.9 | 42.5 | 30.0 | 10.0 | 5.1 | 1.8 |
| Note: Table modified from: HIV Paediatric Prognostic Markers Collaborative Study and the CASCADE Collaboration. J Infect Dis. 2008;197:398-404. | ||||||
| Baseline HIV RNAc (Copies/mL) Baseline CD4 Percentage | No. Patientsd | Deathsb | |
|---|---|---|---|
| Number | Percentage | ||
| ≤100,000 | |||
| ≥15% | 103 | 15 | (15%) |
| <15% | 24 | 15 | (63%) |
| >100,000 | |||
| ≥15% | 89 | 32 | (36%) |
| <15% | 36 | 29 | (81%) |
| a Data from the Eunice Kennedy Shriver National Institute of Child Health and Human Development Intravenous Immunoglobulin Clinical Trial. b Mean follow-up: 5.1 years. c Tested by NASBA® assay (manufactured by Organon Teknika, Durham, North Carolina) on frozen stored serum. d Mean age: 3.4 years. Source: Mofenson LM, Korelitz J, Meyer WA, et al. The relationship between serum human immunodeficiency virus type 1 (HIV-1) RNA level, CD4 lymphocyte percent, and long-term mortality risk in HIV-1-infected children. J Infect Dis. 1997;175(5):1029–1038. | |||
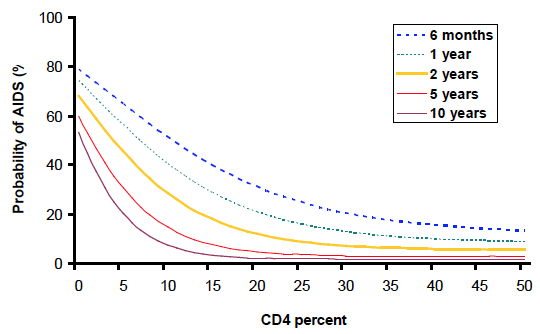
Figure modified from Lancet 2003;362:1605-1611
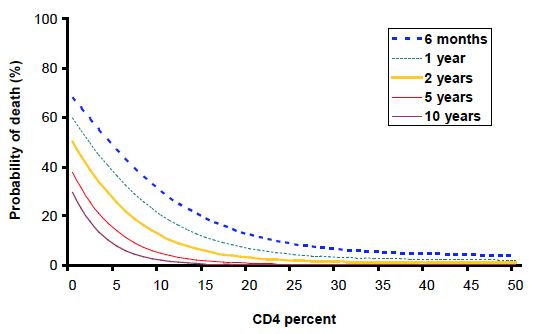
Figure modified from Lancet 2003;362:1605-1611
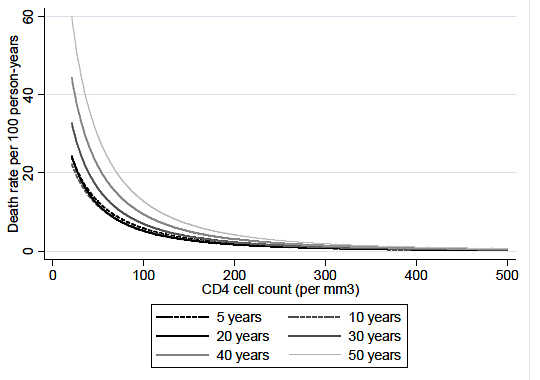
Figure modifed from: HIV Paediatric Prognostic Markers Collaborative Study and the CASCADE Collaboration. J Infect Dis. 2008;197:398-404.
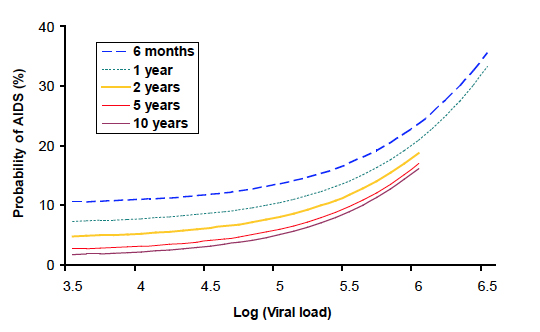
Figure modified from Lancet 2003;362:1605-1611
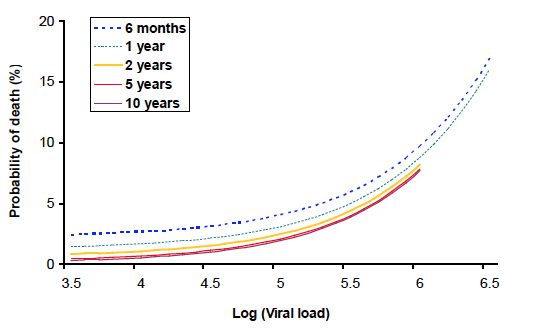
Figure modified from Lancet 2003;362:1605-1611
| CD4 Percentage | Log10 HIV RNA Copy Number | ||||||
|---|---|---|---|---|---|---|---|
| Age | 10% | 20% | 25% | 30% | 6.0 | 5.0 | 4.0 |
| Percent Mortality (95% Confidence Interval) | |||||||
| 6 Months | 28.7 | 12.4 | 8.5 | 6.4 | 9.7 | 4.1 | 2.7 |
| 1 Year | 19.5 | 6.8 | 4.5 | 3.3 | 8.8 | 3.1 | 1.7 |
| 2 Years | 11.7 | 3.1 | 2.0 | 1.5 | 8.2 | 2.5 | 1.1 |
| 5 Years | 4.9 | 0.9 | 0.6 | 0.5 | 7.8 | 2.1 | 0.7 |
| 10 Years | 2.1 | 0.3 | 0.2 | 0.2 | 7.7 | 2.0 | 0.6 |
| Percent Developing AIDS (95% Confidence Interval) | |||||||
| 6 Months | 51.4 | 31.2 | 24.9 | 20.5 | 23.7 | 13.6 | 10.9 |
| 1 Year | 40.5 | 20.9 | 15.9 | 12.8 | 20.9 | 10.5 | 7.8 |
| 2 Years | 28.6 | 12.0 | 8.8 | 7.2 | 18.8 | 8.1 | 5.3 |
| 5 Years | 14.7 | 4.7 | 3.7 | 3.1 | 17.0 | 6.0 | 3.2 |
| 10 Years | 7.4 | 2.2 | 1.9 | 1.8 | 16.2 | 5.1 | 2.2 |
| Note: Table modified from: HIV Paediatric Prognostic Markers Collaborative Study Group. Lancet. 2003;362:1605-1611. | |||||||
| Age (Years) | Absolute CD4 Cell Count (cells/mm3) | |||||
|---|---|---|---|---|---|---|
| <50 | 50–99 | 100–199 | 200–349 | 350–499 | 500+ | |
| Rate of Death Per 100 Patient-Years | ||||||
| 0–4 | 59.3 | 39.6 | 25.4 | 11.1 | 10.0 | 3.5 |
| 5–14 | 28.9 | 11.8 | 4.3 | 0.89 | 0.00 | 0.00 |
| 15–24 | 34.7 | 6.1 | 1.1 | 0.71 | 0.58 | 0.65 |
| 25–34 | 47.7 | 10.8 | 3.7 | 1.1 | 0.38 | 0.22 |
| 35–44 | 58.8 | 15.6 | 4.5 | 0.92 | 0.74 | 0.85 |
| 45–54 | 66.0 | 18.8 | 7.7 | 1.8 | 1.3 | 0.86 |
| 55+ | 91.3 | 21.4 | 17.6 | 3.8 | 2.5 | 0.91 |
| Rate of AIDS or Death per 100 Patient-Years | ||||||
| 0–4 | 82.4 | 83.2 | 57.3 | 21.4 | 20.7 | 14.5 |
| 5–14 | 64.3 | 19.6 | 16.0 | 6.1 | 4.4 | 3.5 |
| 15–24 | 61.7 | 30.2 | 5.9 | 2.6 | 1.8 | 1.2 |
| 25–34 | 93.2 | 57.6 | 19.3 | 6.1 | 2.3 | 1.1 |
| 35–44 | 88.1 | 58.7 | 25.5 | 6.6 | 4.0 | 1.9 |
| 45–54 | 129.1 | 56.2 | 24.7 | 7.7 | 3.1 | 2.7 |
| 55+ | 157.9 | 42.5 | 30.0 | 10.0 | 5.1 | 1.8 |
| Note: Table modified from: HIV Paediatric Prognostic Markers Collaborative Study and the CASCADE Collaboration. J Infect Dis. 2008;197:398-404. | ||||||
| Baseline HIV RNAc (Copies/mL) Baseline CD4 Percentage | No. Patientsd | Deathsb | |
|---|---|---|---|
| Number | Percentage | ||
| ≤100,000 | |||
| ≥15% | 103 | 15 | (15%) |
| <15% | 24 | 15 | (63%) |
| >100,000 | |||
| ≥15% | 89 | 32 | (36%) |
| <15% | 36 | 29 | (81%) |
| a Data from the Eunice Kennedy Shriver National Institute of Child Health and Human Development Intravenous Immunoglobulin Clinical Trial. b Mean follow-up: 5.1 years. c Tested by NASBA® assay (manufactured by Organon Teknika, Durham, North Carolina) on frozen stored serum. d Mean age: 3.4 years. Source: Mofenson LM, Korelitz J, Meyer WA, et al. The relationship between serum human immunodeficiency virus type 1 (HIV-1) RNA level, CD4 lymphocyte percent, and long-term mortality risk in HIV-1-infected children. J Infect Dis. 1997;175(5):1029–1038. | |||
Download Guidelines
- Section Only PDF (235.82 KB)
- Full Guideline PDF (6.12 MB)
- Recommendations Only PDF (310.69 KB)
- Tables Only PDF (1.17 MB)
- Drug Tables Only PDF (2.39 MB)